Event Configurations
Event configurations allow xConnect users to be notified of any abnormality within your monitored devices.
There are 3 different types of event configurations:
1. Global Events: These are applied to a device type and telemetry point. Some global events are predetermined based on our preset thresholds that we have configured over the development of the xConnect platform.
2. Custom Events: These can be applied to a specific gateway, server, or device.
Example: Throw an error severity event if GATEWAYABC:Server-XYZ has RAM Utilization beyond 80%.
3. Outage Events An outage event is when there is no received telemetry for a device over a specified amount of time. These alerts/events apply to an entire category of monitored assets (i.e. Servers, IP Devices, Cameras, etc...) This is meant to act as an alerting mechanism from the xConnect platform.
Accessing Event Configurations
1. Log in as a power user
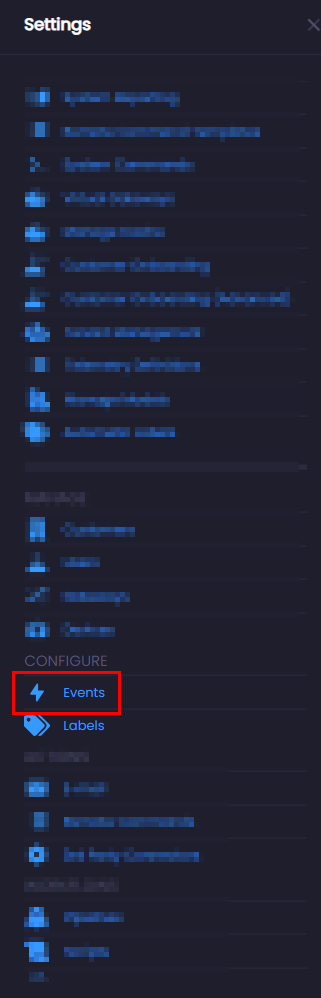
2. Click on the settings icon on the header menu

3. Click on the "Events" menu item in the "Configure" section
Global Event Configurations
Note
As of release 2024.01.0 (January, 2024) users will no longer have access to global event configurations and will be handled by system administrators.
Global event configurations apply to a device type and are automatically defined based on a set of default thresholds that are part of the xConnect platform. All telemetries are considered to be candidates for a global event, but some require additional input. Any global event must have the following information to be used for alerting:
- Operator
- Threshold Value
- Severity
Without these fields defined, the "Requires Input" flag will be enabled and the event cannot be applied to alerts.

Editing Global Events
The global event configuration table allows for in-line editing of existing data. You can edit the Friendly Name, Unit, Operator, Threshold or Severity by simply double-clicking the cell:
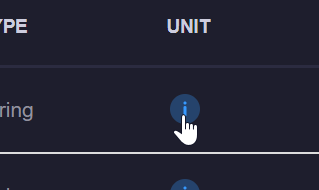
![]()
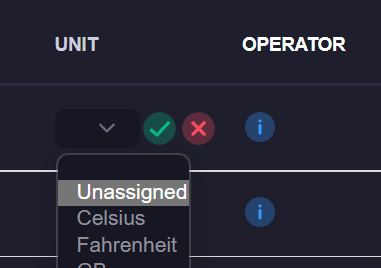
Upon clicking the green check box, the value will be saved and applied.
Custom Event Configurations
Custom event configurations are those that can be applied to a specific gateway, server or device. These events are completely defined by the Power User.
Defining a Custom Event
1. Click on the Custom Configurations tab
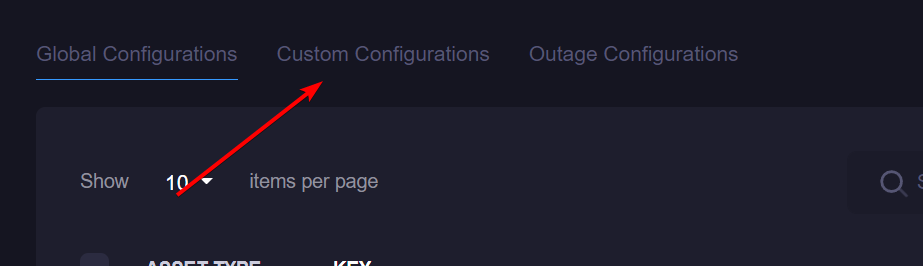
2. Click on the "Create Custom Event" button
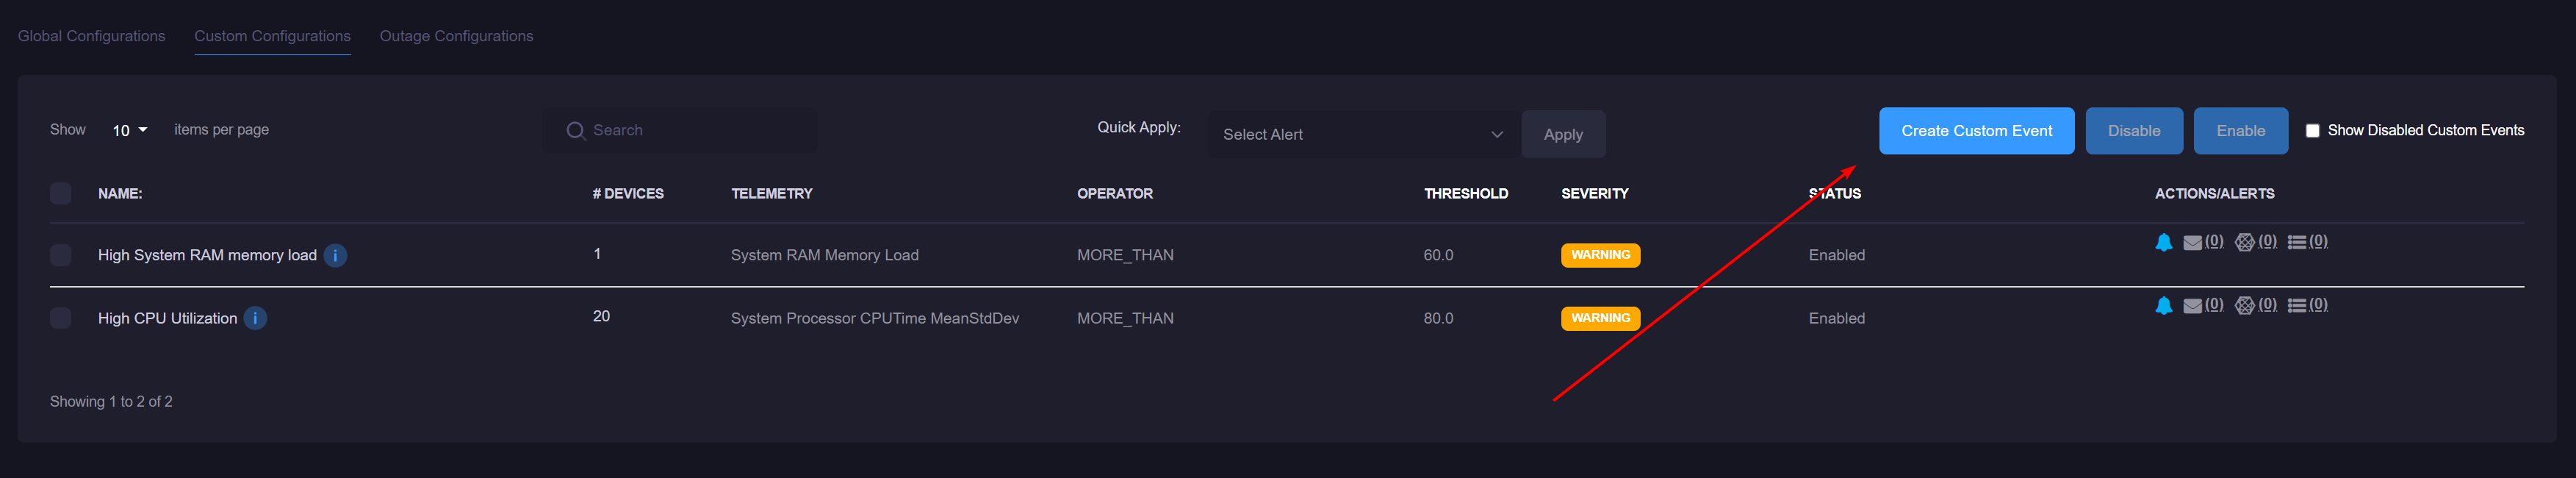
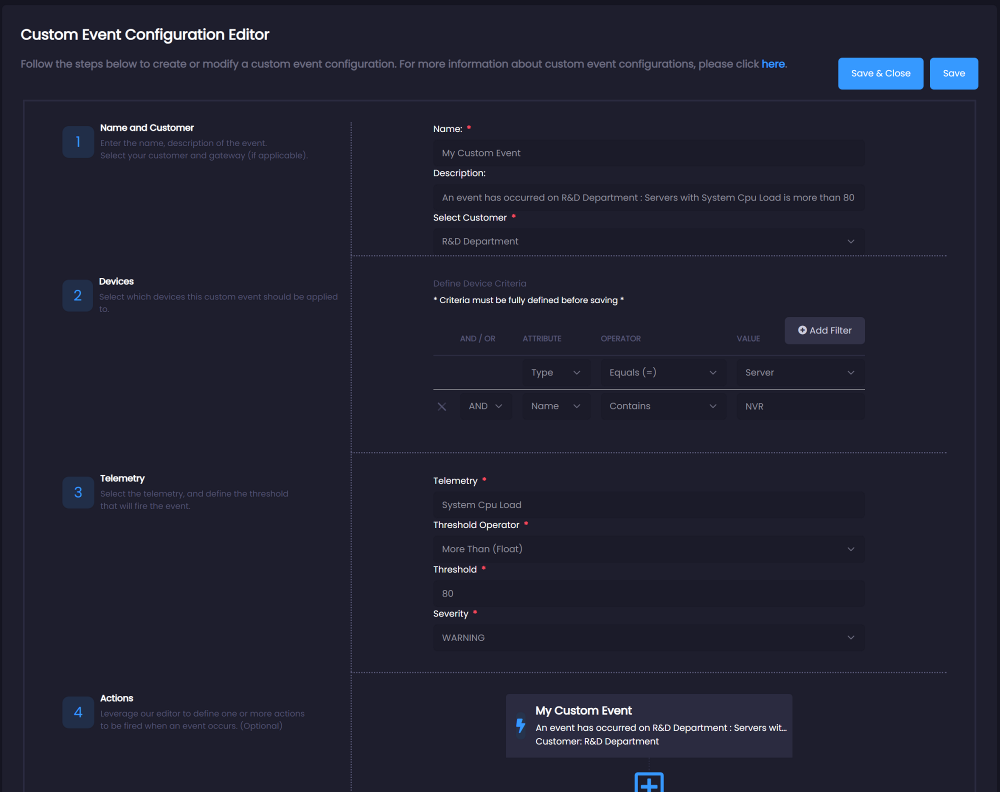
3. The Custom Event Configuration creation wizard will appear. Follow the steps to define your custom event.
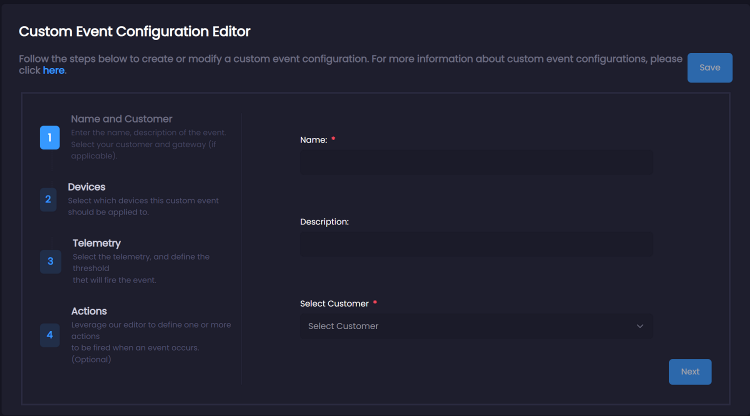
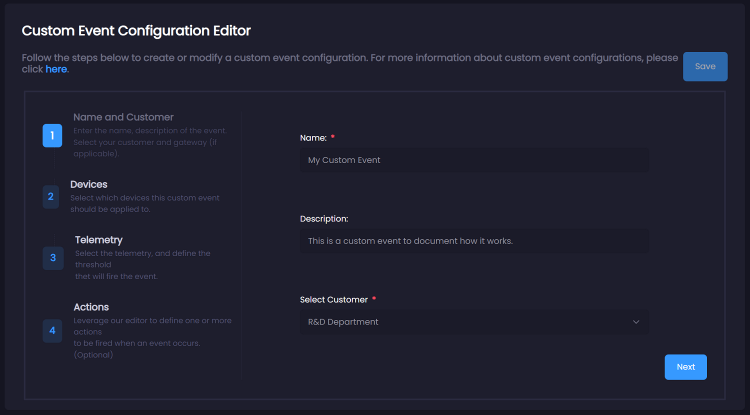
Step 1: Define your event name, description and choose a customer
Custom events require a name to easily be identified in the system. We've also included an optional description field that will allow you to include additional information about your event. Descriptions will be automatically populated with your selected rules if you don't enter anything. The customer selection will apply the event to a particular set of devices that are associated with the customer.
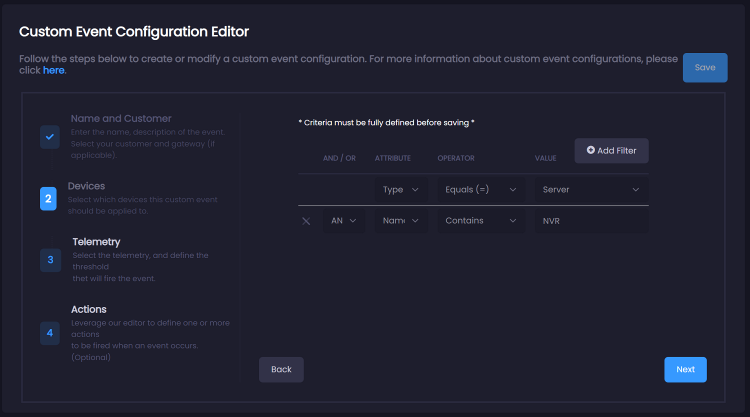
Step 2: Define your device selection criteria
Which devices are applicable to your event? xConnect features a flexible criteria selection tool that empowers you to find the devices you want and exclude those that may not be applicable to your event. Using the controls provided, you can add as many criteria as you'd like.
Note
The tool currently does not allow for grouping criteria. This will be included in a future release to ensure proper handling between AND, OR criteria terms.
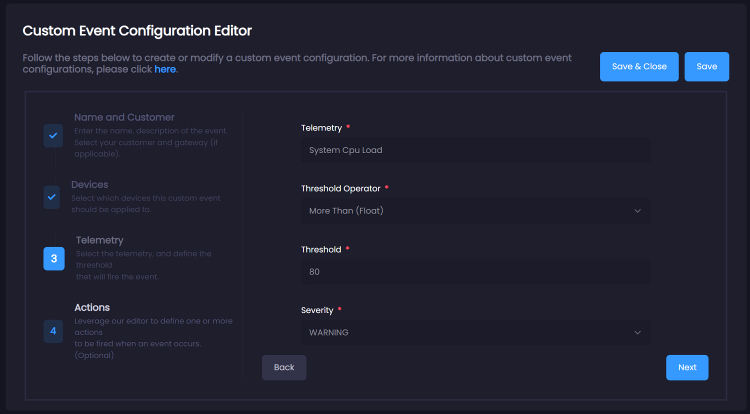
Step 3: Select your criteria, define thresholds
This step drives when your event will be thrown, and determines the level of severity. You can find your desired telemetry by entering its name. The autofill textbox will feature the full name of your telemetry key. The severity will impact how your device(s) appear on your dashboards.
- INFORMATIONAL severity will have no impact on a device health. These should be used for tracking purposes only.
- WARNING severity forces your device in a "WARNING" health status. The warning status should be used for events that may cause a potential problem with the function of your device.
- ERROR severity puts your device in a bad/unhealthy status. Should be used for important issues that need to be addressed ASAP.
- CRITICAL severity puts your device in a bad/unhealthy status. This should indicate a significant issue on a device.
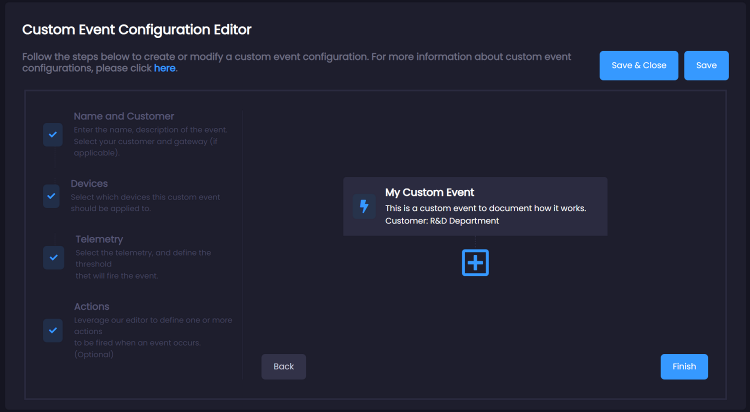
Step 4: Add actions
Actions are e-mail alerts, remote commands, zapier alerting, or 3rd party connectors that execute upon the occurrence of your custom event. The custom event does not require any actions to be defined, you can simply click the "Save" button if you do not have any actions to add.
These can be added by clicking the "+" icon and selecting one or more actions:
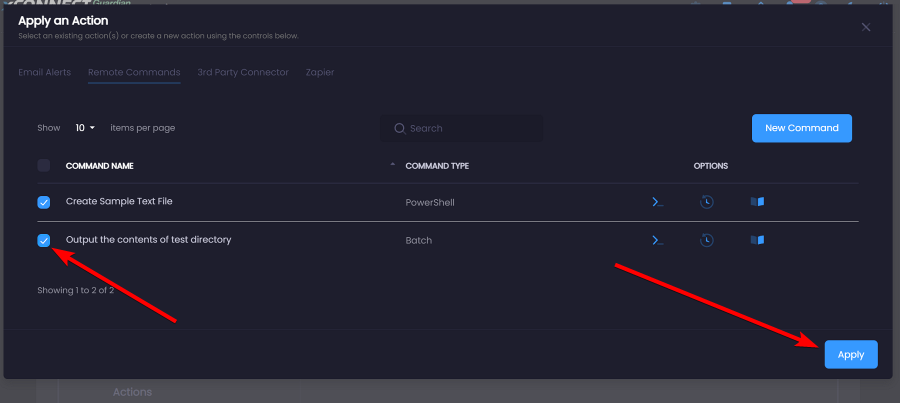
Click on one or more actions, and click apply to add them to your event:
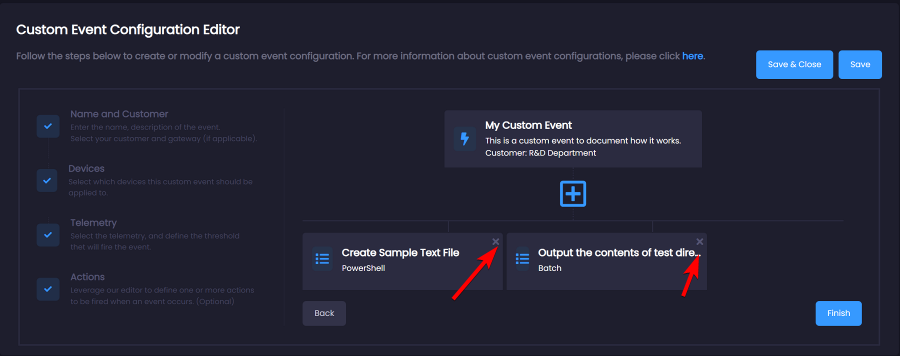
If you would like to remove any actions, simply click on the "x" icon in the corner of each action:
Editing a custom event
The custom event editor is a consolidated view of the creation wizard and enables you to modify any portion of your event from a single page.
Change one or more fields of your custom event using the controls provided. Click the "Save" button once you are finished and the event will be updated.
Outage Configurations
Outage configurations apply to scenarios where an asset/device type has not received telemetry in a defined period of time. Example: Alert via e-mail when any server has not sent telemetry in 30 minutes.
Defining an outage configuration
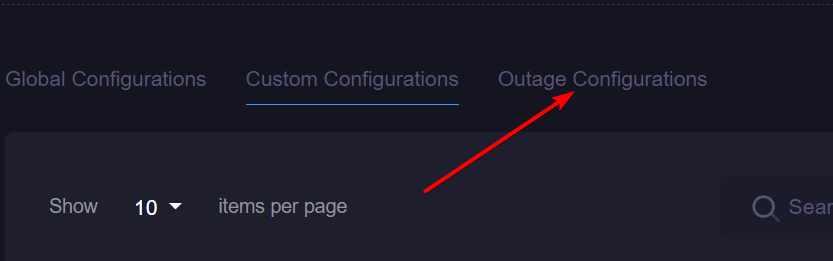
1. Click on the Outage Configurations tab
2. Click on one of the alert mechanisms in the right column, choose one or more alerts to enable on your outage configuration. Upon selecting an alert, default values will appear for the configuration:
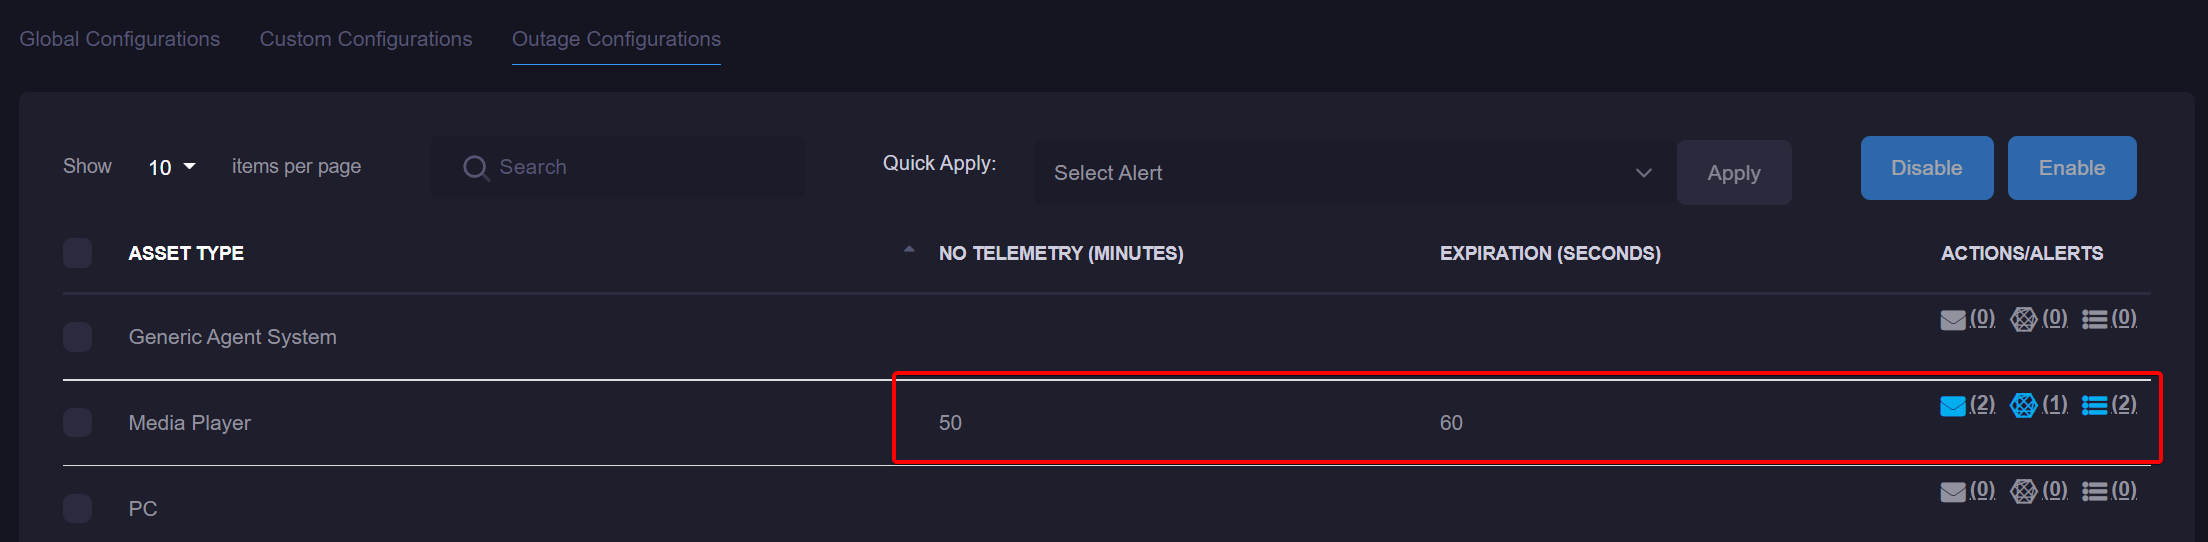
2. Double click on either the No Telemetry or Expiration cells. The No Telemetry (Minutes) column defines how many minutes you would like to wait until a no telemetry event is detected. The Expiration field is how long it will take before another notification/action is executed. Example: Detect when there is no telemetry for 60 minutes and alert me every 24 hours.
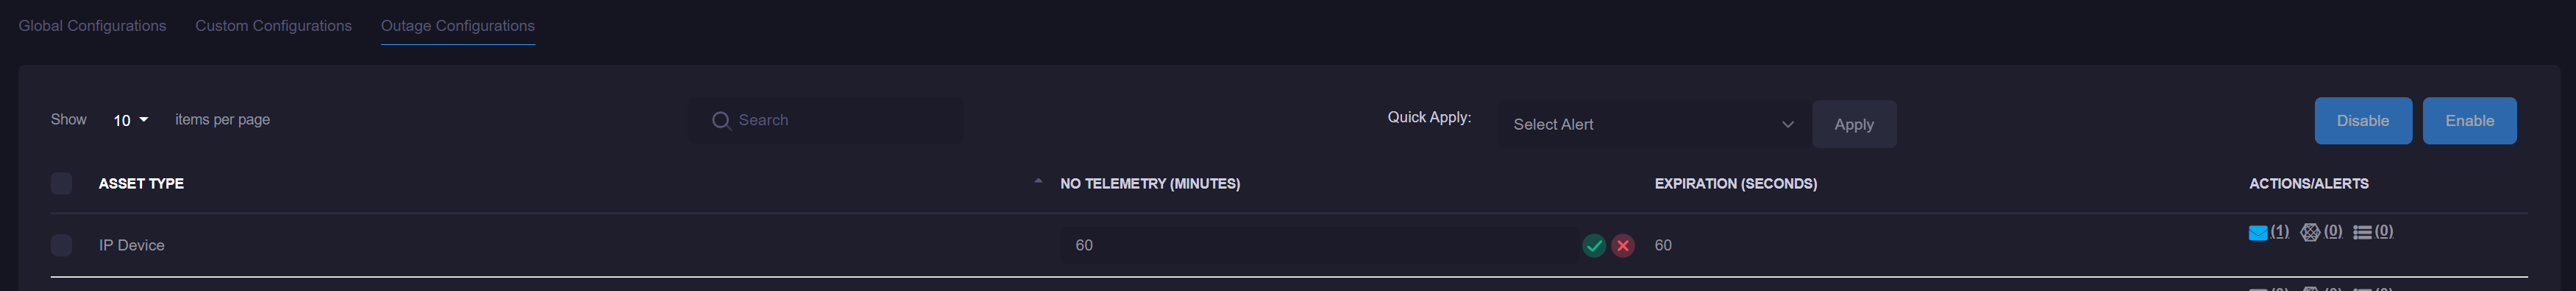
Once the outage is fully defined, your alert will fire appropriately.
Applying an alert
An E-mail, Remote Command, or 3rd Party Connector can be applied to any event configuration by leveraging the action column in the grids. Note: Only events that are fully defined and do not require input can be used for alerting.
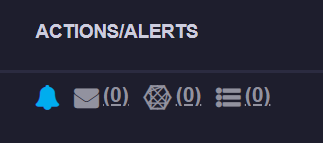 The number next to each icon indicates how many actions for each category are active for this event.
Actions Defined:
![]() Dashboard Notifications: determines if the event will appear on the dashboard notifications list.
Dashboard Notifications: determines if the event will appear on the dashboard notifications list.
 E-mail Alerts: upon this event firing, an e-mail will be generated based on your associated e-mail profile. See Email Profiles for more information.
 Remote Commands: a command will automatically be executed upon the occurrence of the event. See Remote Commands for more information.
 Third Party Commands: call to an external REST-based API will be made upon the occurrence of the event. See Third Party Commands
![]() Zapier Notifications: enables or disables the ability for this event to notify the Zapier platform with the occurrence of the event. See Zapier Notifications
Zapier Notifications: enables or disables the ability for this event to notify the Zapier platform with the occurrence of the event. See Zapier Notifications
Activating an Alert
Click the e-mail, connector, or command icon. This will open a modal that features a list of available alerts to apply:
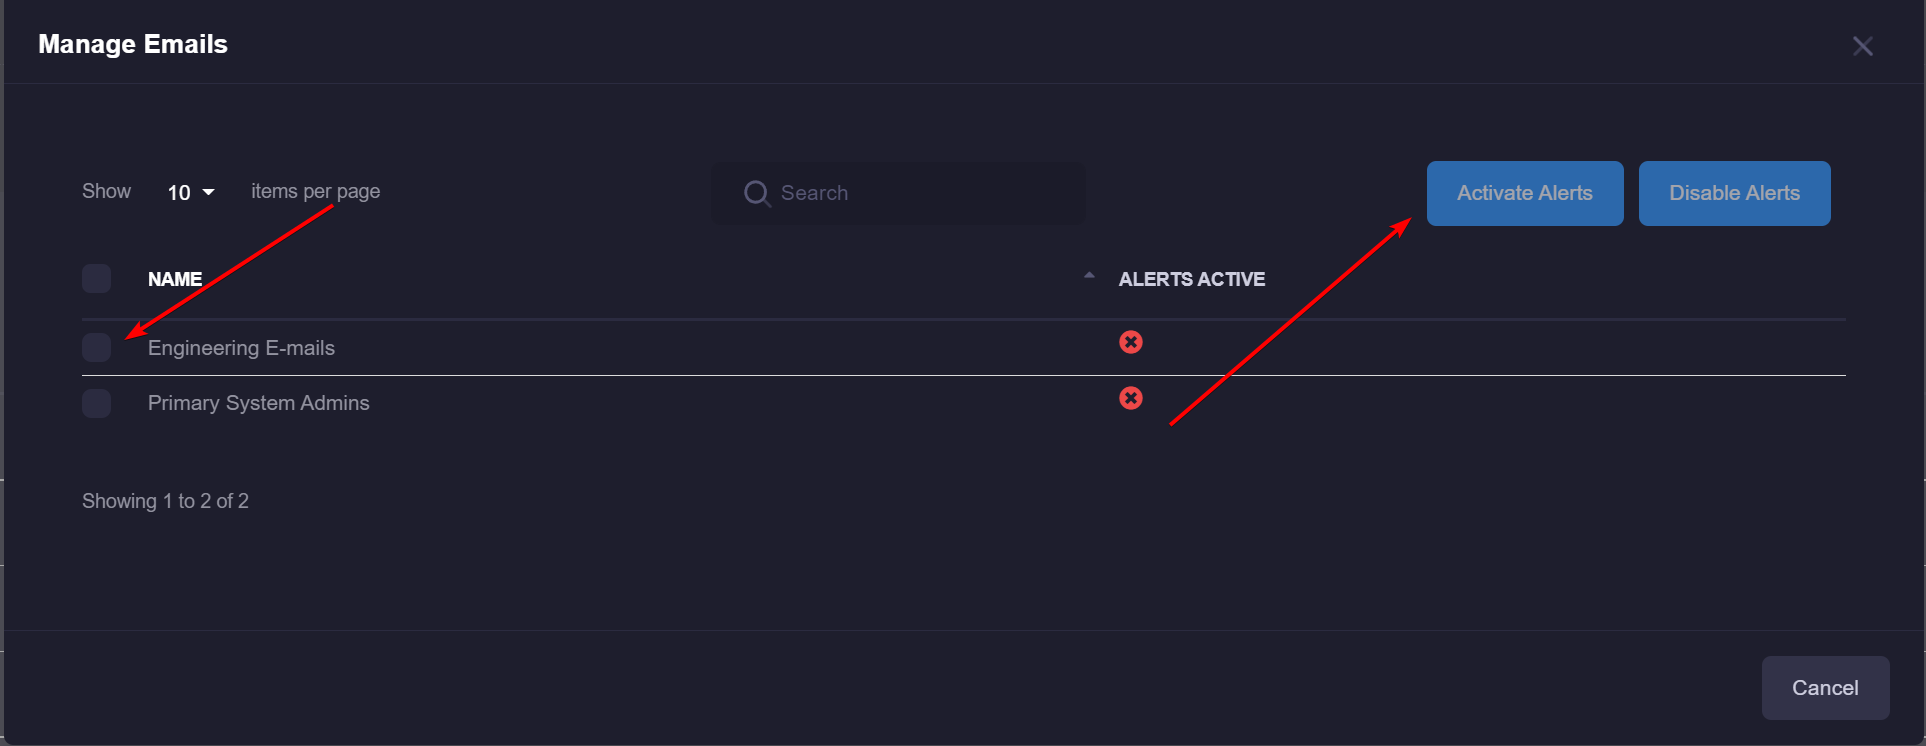
Select 1 or more alerts and click the "Activate Alerts" button. If you would like to disable alerts, click the "Disable Alerts" button.
Once this has been done, the alerts will be applied to your event and the alerts will fire upon the occurrence of the event.